SPEED UP THE DIAGNOSIS
Diagnosis of your installations
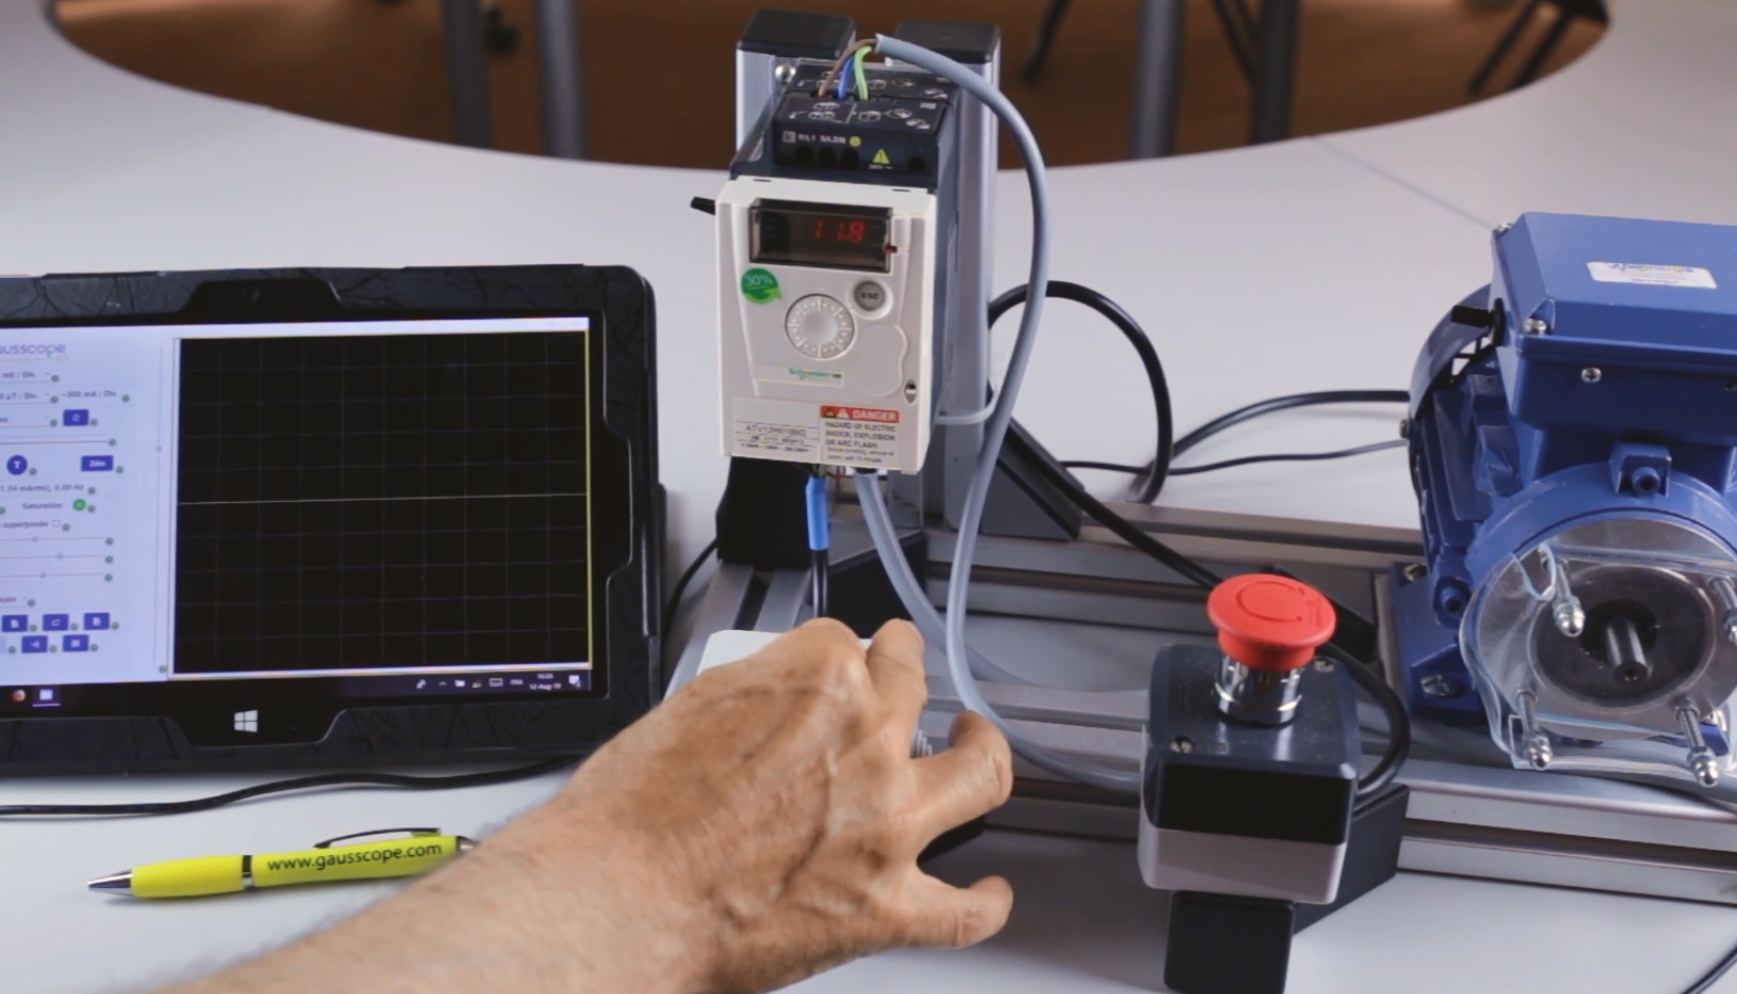
- Detect anomalies in the electrical signals of your equipment: drives, motors, power supplies, etc., without having to intervene in the wiring.
- The information is safely taken directly from the input and/or output wires of the equipment you want to check.
- The system operates independently. Coupled with a tablet or laptop, the visualisation software enables you to interpret the shape of the electric current, in real time at no load or with load increases.
- By comparing with typical diagrams we provide you with, you can characterise the signal anomalies symptomatic of faulty equipment.
- The accuracy of the diagnosis will enable you to choose more quickly the nature of the intervention to be carried out: you need replace only the parts which require it, which saves you time!
Examples of use
Variable speed drives

- On a production line, a motor may show the following phenomena: power failure, vibrations, choppy or jerky operation.
- The information is taken safely with a Gausscope in contact with the wires, and the current display shows the location and origin of the fault upstream, within the motor itself or at the load.
- This factual information speeds up the decision on whether to replace or repair.
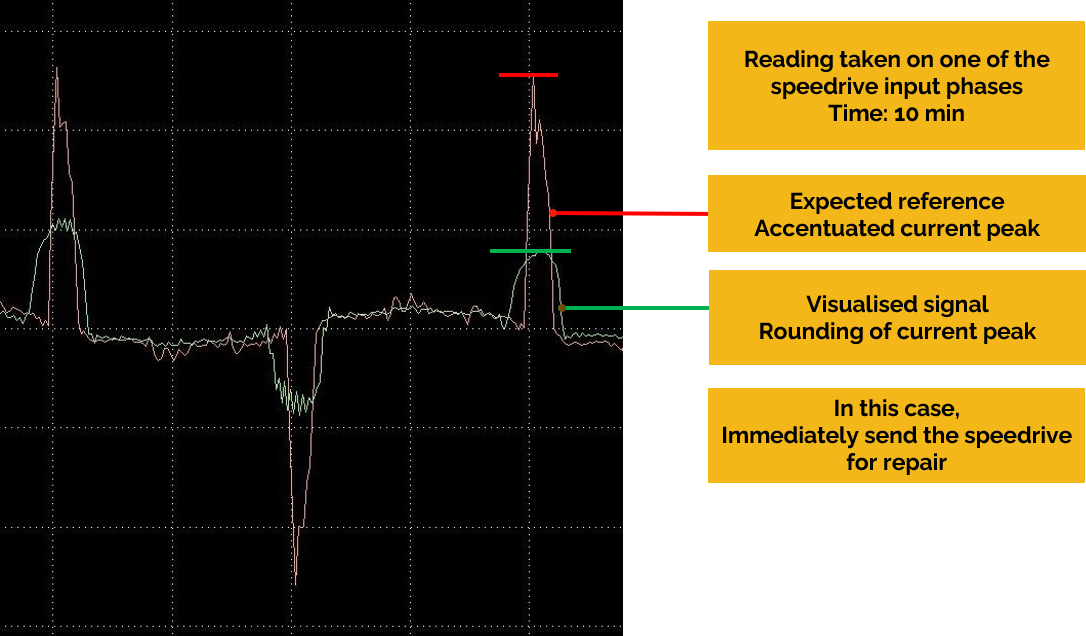
- The green curve on the equipment shows a significant deviation from the expected reference shown by the red curve, which makes it possible to characterise a critical ageing of the drive’s bus capacities and to send it for repair.
- NB: A current clamp erases the difference between these two signals, making it impossible to identify the fault. An oscilloscope displays voltages and does not show faults in currents.
The motors

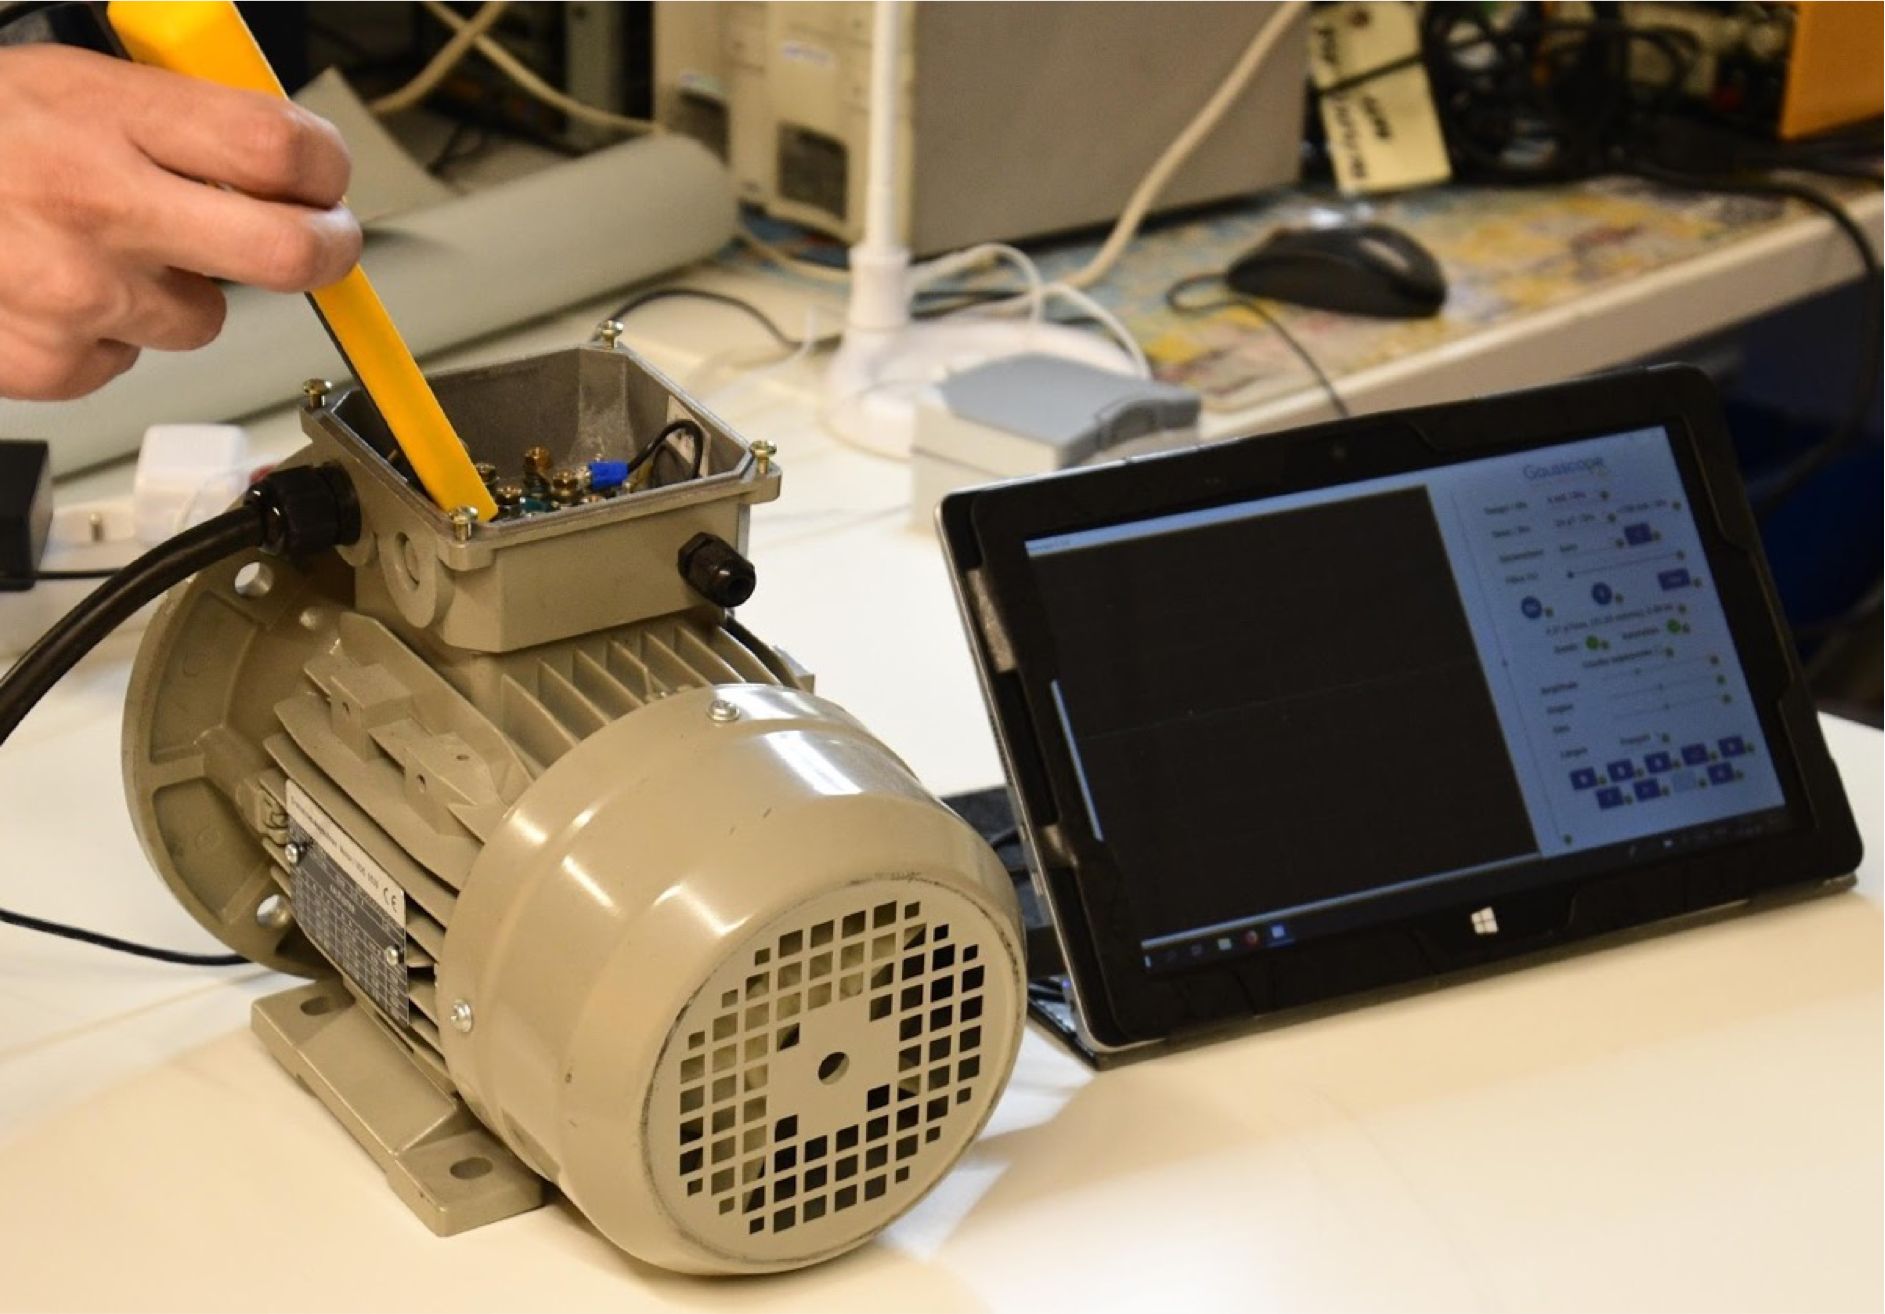
- On a production line, a motor may show the following phenomena: power failure, vibrations, choppy or jerky operation.
- The information is taken safely with a Gausscope in contact with the wires, and the current display shows the location and origin of the fault upstream, within the motor itself or at the load.
- This factual information speeds up the decision on whether to replace or repair.
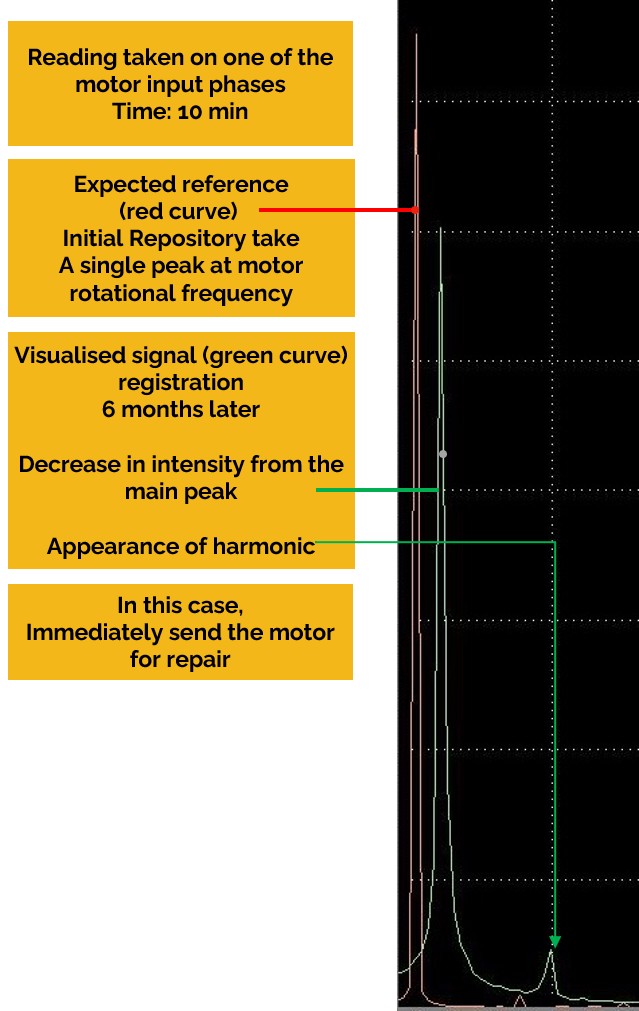
- The appearance of harmonics can be visualised with a frequency approach. In this example, the shape of the signal is indicative of an imperceptible vibration at the motor load: bearing, bearing, etc. ?
- By observing the current curves, it becomes possible to discriminate between mechanical and electrical problems.
- NB: A thermal recording cannot show this defect. Vibrational recordings are harder to interpret.
Switching power supplies
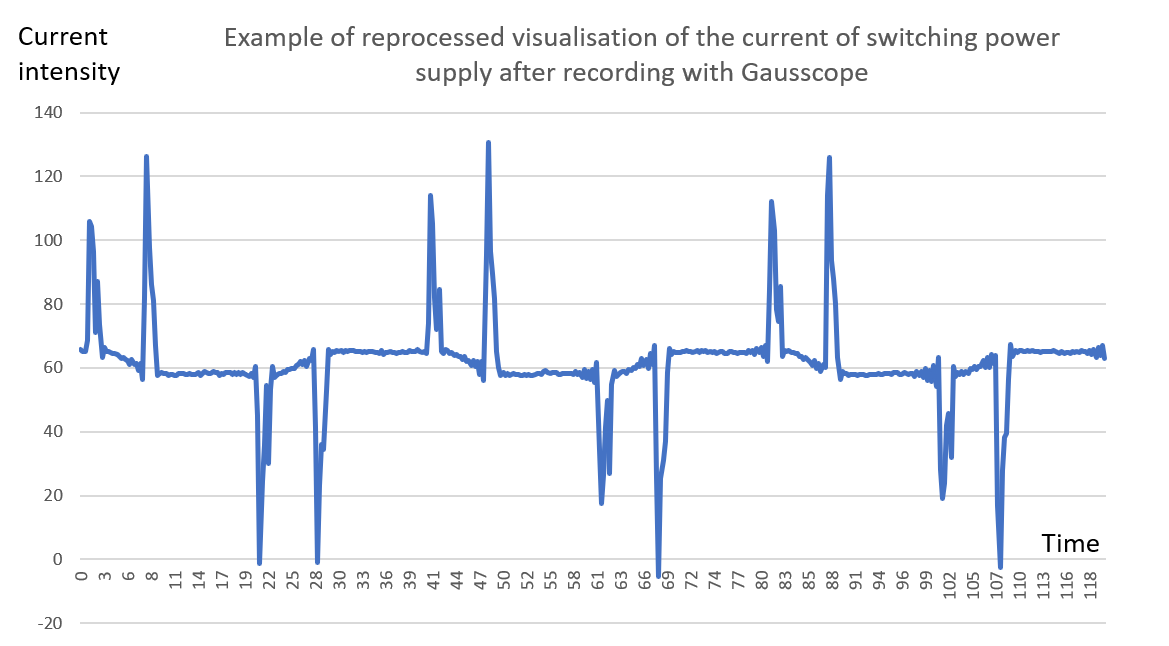
On a production line, we observe the following phenomena: absence or faulty power supply, choppy or jerky operation.
The information is safely collected with a Gausscope in contact with the wires, the visualisation highlights the location and origin of the fault upstream, downstream or within the switch mode power supply.
This factual information speeds up the decision on whether to replace or repair.
Trouble shooting guide PDF on request
If you would like to receive our documentation in PDF format, please fill in our form.
- Gausscope presentation and its offer
- Guide to known and identifiable faults
- User manual
- Technical manual
Maintenance action
Once you have identified the faulty component, if the fault concerns electrical equipment such as the power supply or the speed controller, you can send your equipment to an electronic repair professional to find a solution for repair, reconditioned supplies or the purchase of new equipment.
You can contact the company E-NERGIE www.e-nergie.fr. If the fault concerns an asynchronous motor or a brushless motor, you can contact a winding specialist.


