ORGANISE OPTIMAL MONITORING
ORGANISE OPTIMAL MONITORING OF YOUR ELECTRICAL EQUIPMENT
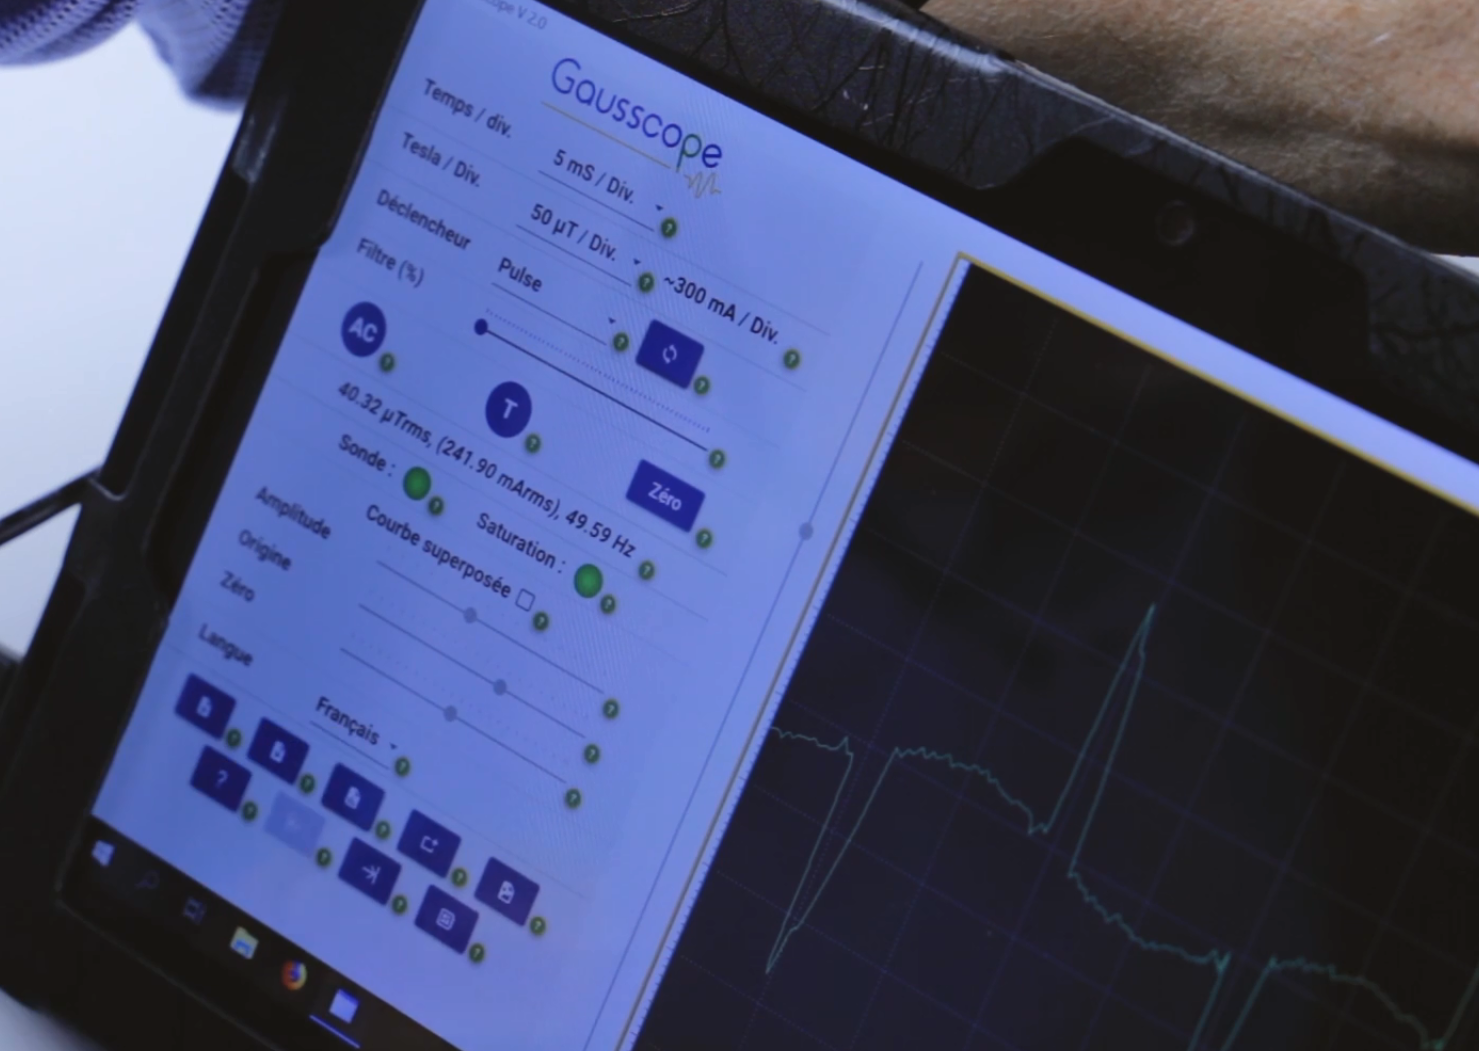
- Comparing current signals with a benchmark enables you to evaluate the ageing of your equipment and improve your failure anticipation.
- Depending on your machine fleet, your breakdown history or the criticality of possible incidents, we can help you define your equipment monitoring programme.
- This monitoring programme can be carried out by your in-house teams or outsourced to our partners depending on your workload. The first survey campaign carried out according to the programme constitutes the baseline for your equipment. The following campaigns highlight possible deviations due to ageing and provide factual elements for decisions on purchases, repairs or revisions of equipment.
Data Collection
Point recording procedure
- Comparing current signals with a benchmark enables you to evaluate the ageing of your equipment and improve your failure anticipation.
- Create a registration folder on your Windows folders: Ideally one file per piece of equipment.
- Adjust the scrolling and amplitude to achieve a satisfactory view
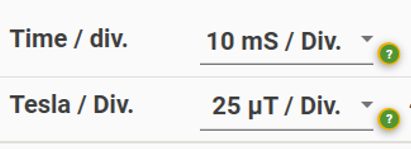
- Set the shutter to Pulse to freeze the recording

- Save the file in xml format using or Save the file in jpeg format using
- Name the file as follows :
“Year/Month/Day – Company – Device identification – Phase 1/2/3 – Temporal or Frequential – xml or jpeg”
Examples :
210512 – E-NERGIE – Siemens production line 3 drive – Phase 2 – Frequential – xml
210624 – E-NERGIE – Siemens production line 3 drive – Phase 3 – Time – jpeg
-> Send your files to expertise@gausscope.com <-
(interpretation quote on request)
Data mining
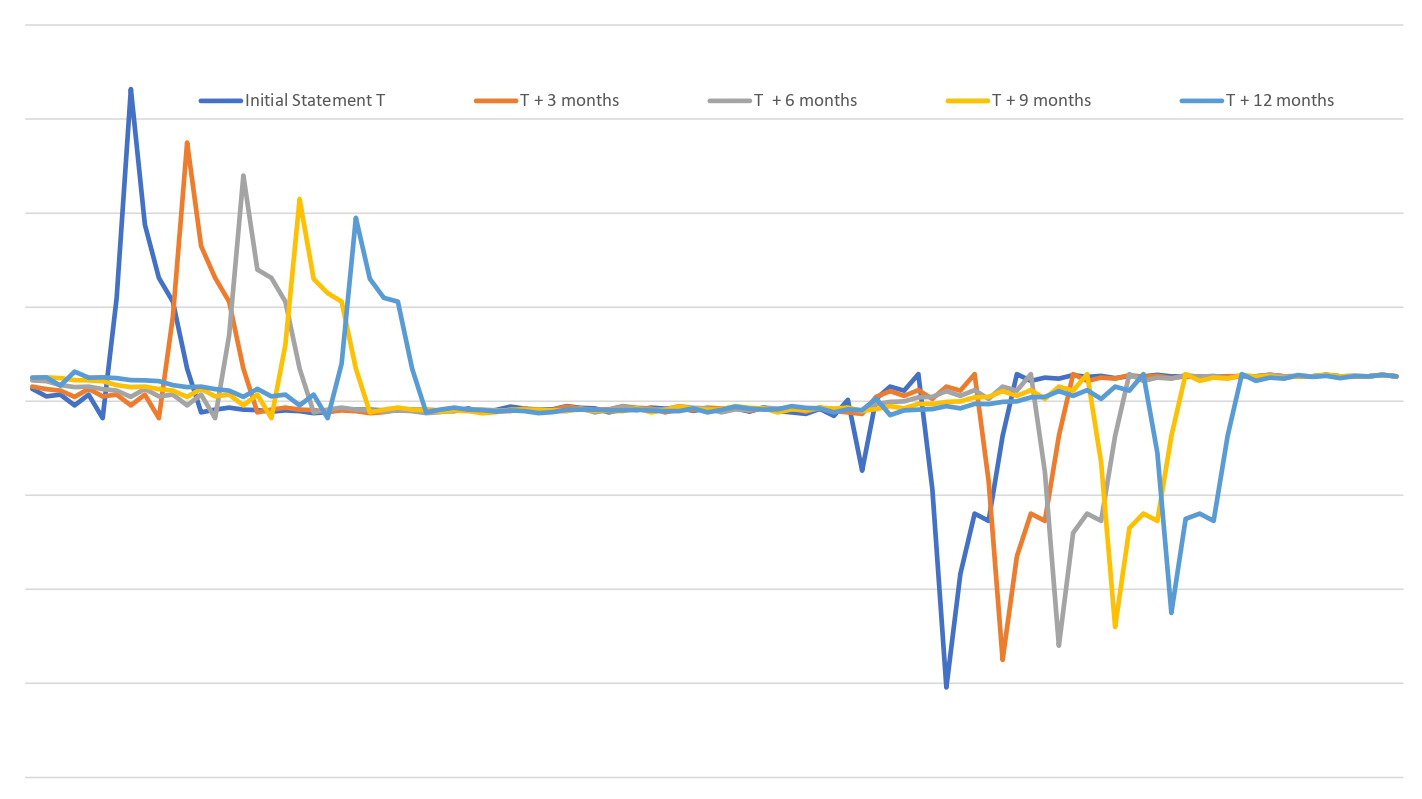
It is possible to re-process the data collected and recorded with Gausscope. The data is stored in xml format. It is then sufficient to periodically monitor the evolution of the recordings and thus detect warning signals and early ageing of the equipment.
Example of the evolution over time of a switch mode power supply
Examples of Processing
L1/L2/L3 time input sentences on a drive - 30 kW
The processing of the xml files makes it possible to visualise all the phases on the same graph.
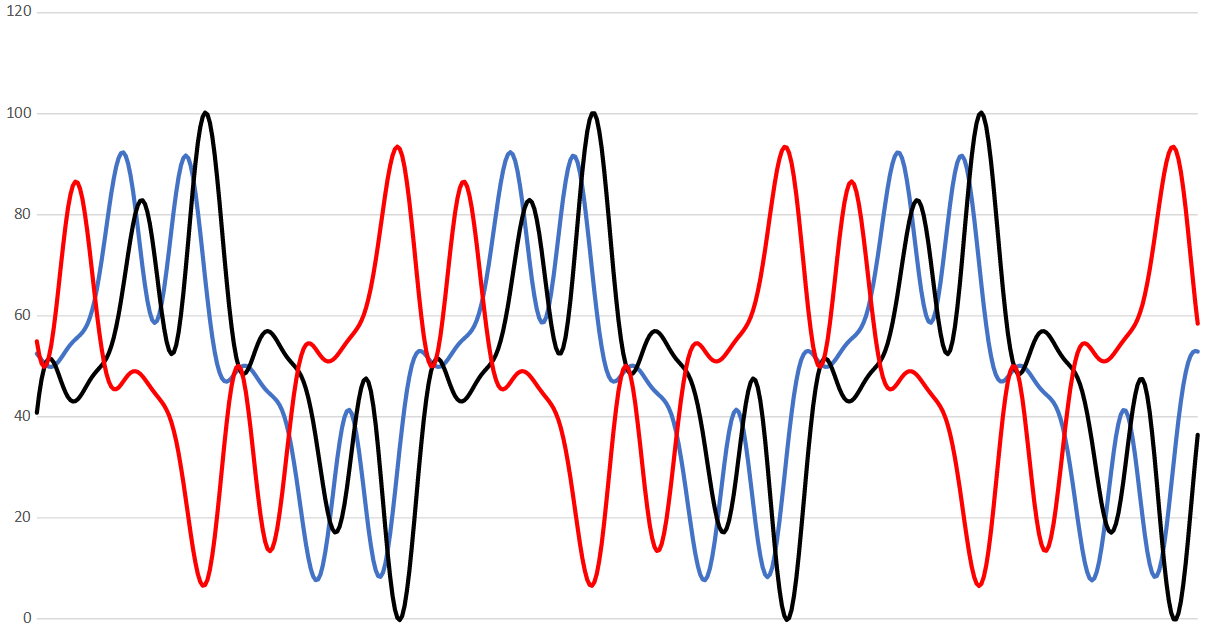
The switching on this drive works perfectly on all 3 phases. This will be used as a reference to analyse the following drive. L1/L2/L3 time input phase readings on a similar drive – 30kW
L1/L2/L3 time input phase readings on a similar drive - 30kW
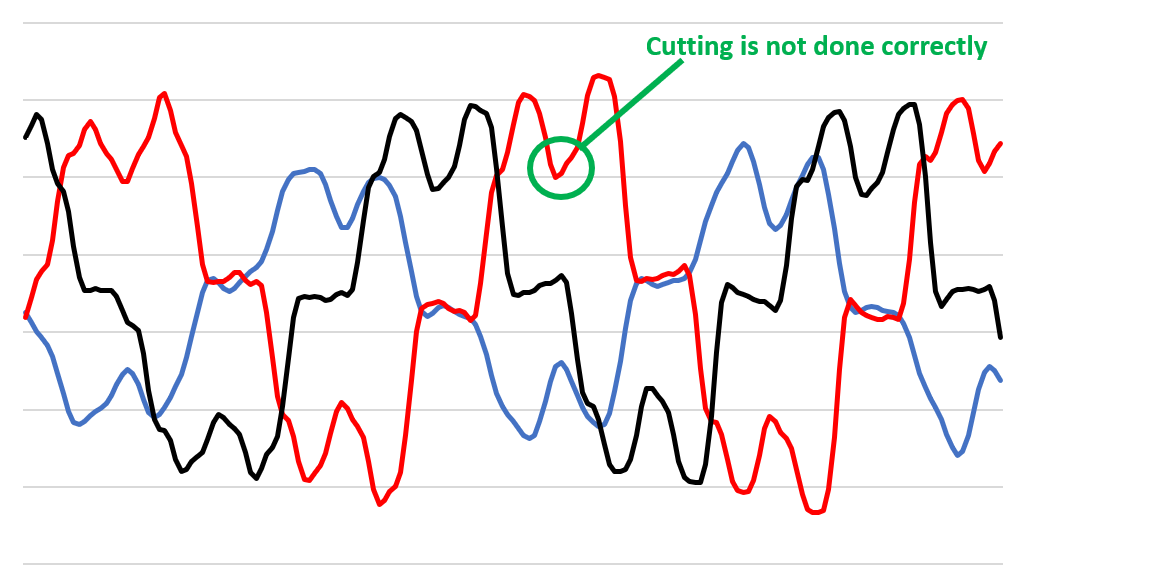
None of the drive’s input phases are cutting properly, which may cause the drive to heat up too soon.
Recommendation: Send the drive for servicing. Re-register after the revision to validate the repair. U/V/W time input phase readings on an inverter output motor – 30 kW
U/V/W time input phase readings on an inverter output motor - 30 kW
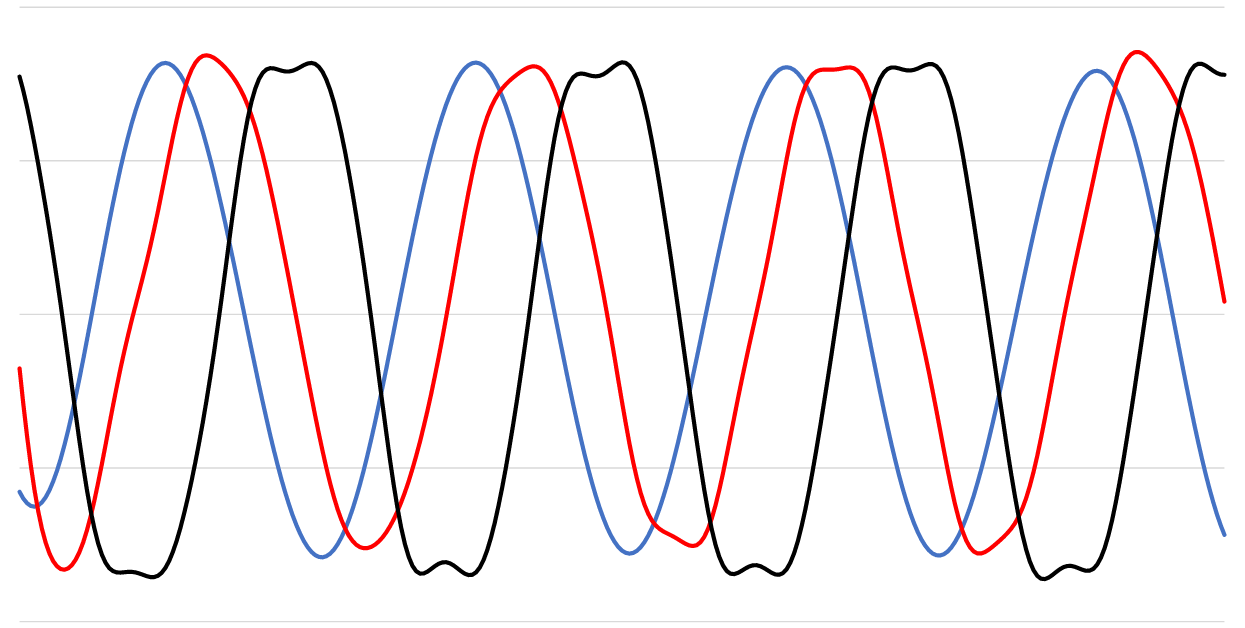
The motor is working properly. No corrective action to be taken in the short term.
Maintenance policy
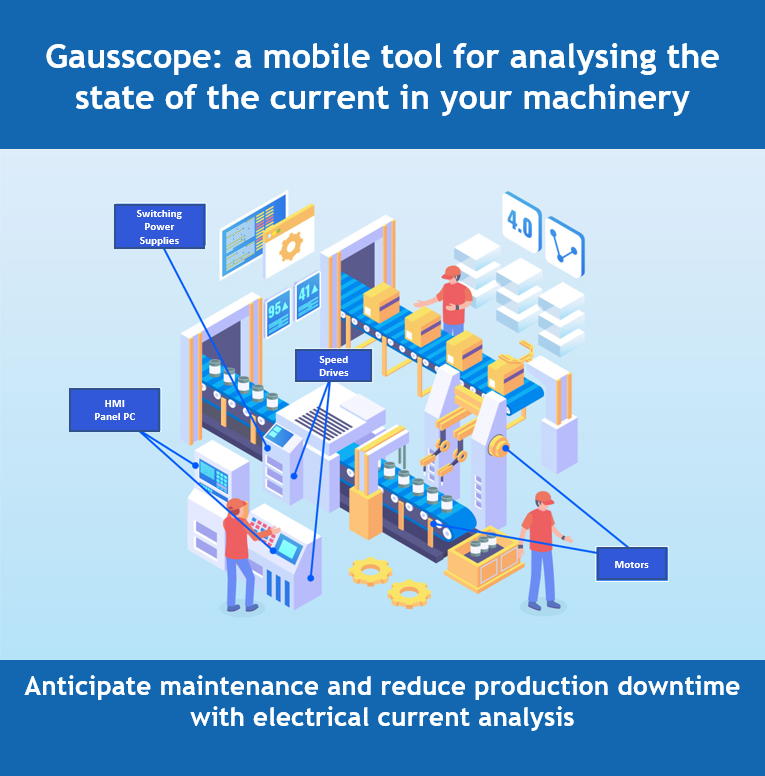
- Define your needs on your facilities :
- How many drives do you have?
- How many motors do you have?
- How many switch mode power supplies do you have?
- What is your critical equipment?
- Are you considering implementing a predictive maintenance solution on your site?
- You can hire Gausscope, purchase it and choose one of our services :
- audit or survey services
- expert assessment and data analysis for increasing competence in current analysis


